CourseMill reporting is divided into two primary categories: General and Parameter Driven. Both types of reports will be described further down in this document.
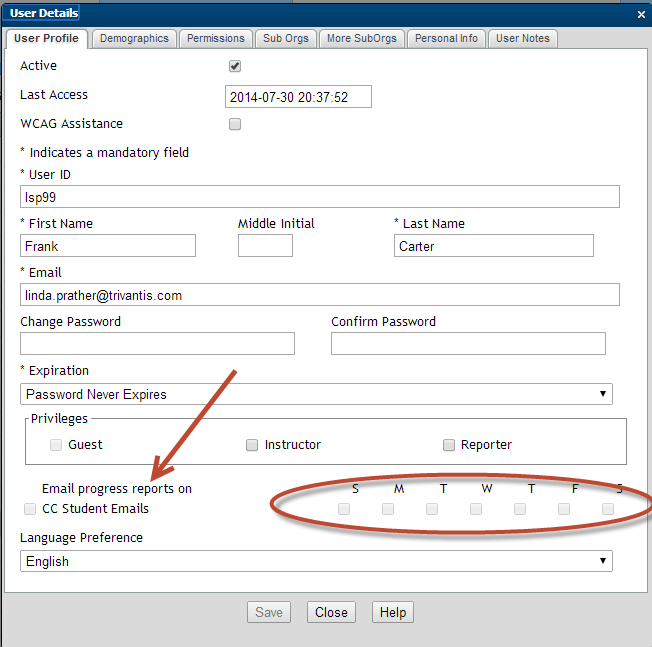
Progress Reports are also available to reporters. These can be set up to be automatically sent to them based on the selection that is chosen in the reporter’s user profile as shown below. A sample of a progress report that is emailed out is shown on the next page. We recommend not using this report as it is probably the first one ever developed in CourseMill and is not very “friendly”. The only reason to possibly use this is that, today, it drives two other notifications to the managers: Evaluations and Approvals. If you are not using either one, we suggest not using Progress Reports.
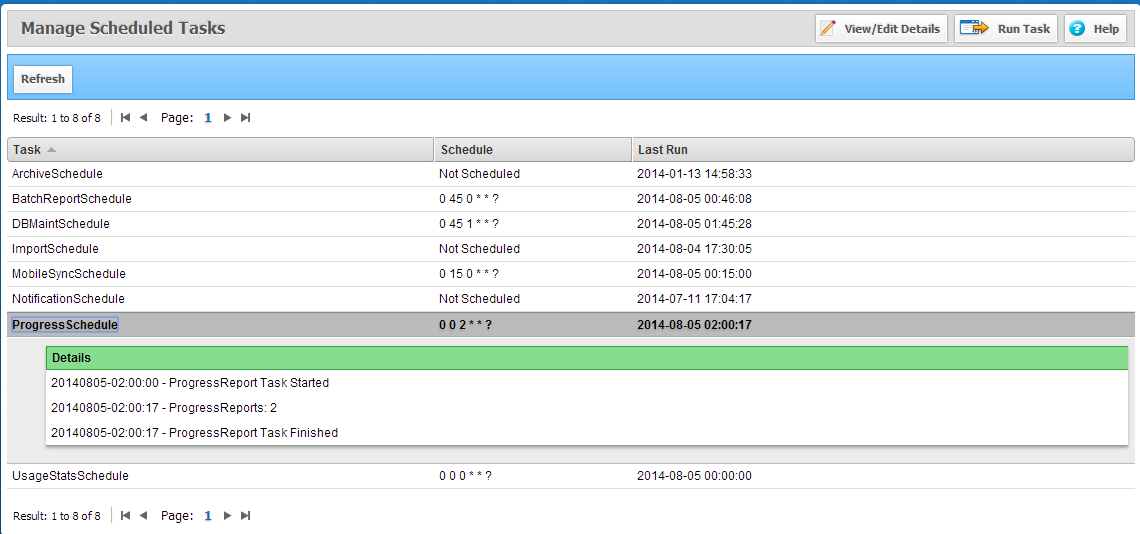
| These reports are generated on an automatic schedule as your administrator defines in the Manage Scheduled Task option as shown at right. |
|
Sample of a Progress Report:

With CourseMill, there are approximately 47 standard reports providing a foundation for extracting system data. These general reports are not typically your daily operational reports. They are more static reports and used when setting up the system or diagnosing a problem. The SQL statements that make up these general reports can be copied and pasted as a starting point if you are trying to create a new Custom Report.. Many of these general reports have been re-created in our new Advanced Reports giving you many more options for creating and changing reports. If you have access to the Advanced Reporting module, we strongly suggest you use that tool for reporting.

The General categories are:
| Administrator | System configuration reporting. |
| Audit | Administrator tool for auditing CourseMill activities. |
| Course |
Course catalogs, notifications, session information and user interactions with courses. |
| Curriculum | Curriculums, Curriculum Catalogs and Curriculum notifications. |
| ECommerce | Course/Curriculum by price, discount codes/percentages. |
| General | These are new custom reports that have been generated for the organization. |
| User | Active/Inactive users, reporters and instructors with permissions. |

|
Admins/Instructors/Reporters will see a listing of these reports as shown on the next page. |
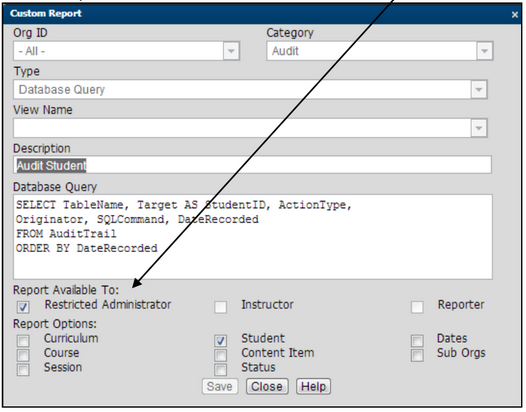
As you click View/Edit Details of any of the General Reports – you will see a screen similar to the following. This screen allows the administrator to select which group of users can have access to that particular report.
Most reports, once run, will display the following navigation bar:

| Options | Modify a set of options parameters set up for the report. | ||
| Download Generated Report |
Download the report in Excel format. |
||
| Graph |
Create a Graph of the report. This is only available in Summary mode. Check Manage Properties for Graph to set up display characteristics. Not all reports have graphs. |
||
| Print Report | Print the report or create a PDF file.
|
||
| Save to Report Locker | Save the report parameters and schedule the report to deliver updated information on a daily, weekly, monthly or quarterly basis. |
Currently there are several custom built reports allowing for selection of data from differing views of the database. Each report is parameter driven with a summary or detail mode. The results from each mode will be quite different. The Summary check box is always at the top of the parameters window and is checked by default. Uncheck Summary to run the report in Detail mode. Most reports, once run, will display a similar navigation bar as shown above.
|
|
If a reporter is also an instructor and the instructor is assigned to a session, reporting as a session level instructor takes precedence when running reports. In other words, the reporter can only run course level reports for sessions he/she is assigned to as an instructor. |
Usage
The Usage reports provide information on the number of logins, number of launches, and number of completions in the organization. This is only available to administrators. Selecting the Options button will bring up the Reports Options pop-up window:
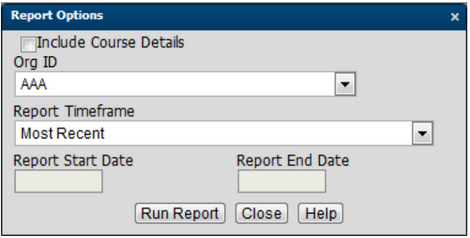
Usage Report Parameters
Check the Include Course Details box to determine if you want the statistics to the course level.
Use the Org ID field to select the organization under which you would like to run the report.
Select the Report Timeframe of the data you would like to see. This will give the options of:
If Custom is selected for the report timeframe, the Report Start Date and Report End Date are enabled for entry.

Click Run Report.
Usage Report Example (run with course details selected)

Student Status
The Student Status report provides information on Summary enrollment status groups or detailed statistics by student when run for Summary or detail statistics data output. Easily complete compliance reporting by instantly running reports on the completion status of courses. See the status for specific names and view access dates. Easily filter out all information by your desired subject and export the reports directly into an Excel spreadsheet.
|
Status Report Parameters Check or uncheck the Summary Statistics box to switch between the two different data displays formats. Select one, or a combination of parameters, to enable the Run Report button. The Status selection provides the ability to select one, or more level options (student, curriculum, course, and/or session) and start and end dates to narrow the report down to your specific needs. Select whether or not you want to see the Sub-Orgs and/or the Personal Info columns on the report. |
Status Report Example

Resources
Provides a list of resources that have been set up in the Resources section of Course Content for all courses within an organization or the organization resources. If you run it in detail it will show you every student who has accessed it.

|
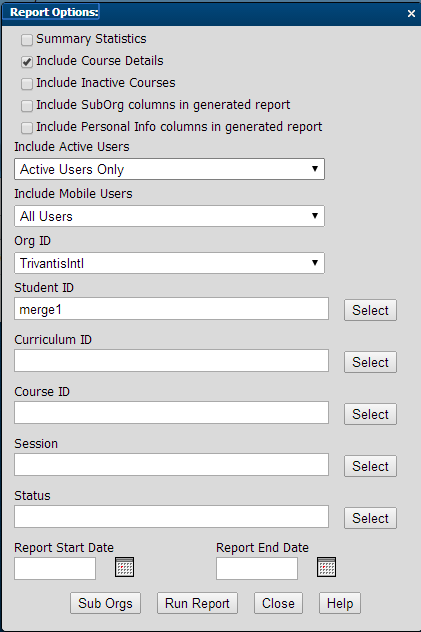
Resources Report Parameters Check or uncheck the Summary Statistics box to switch between the two different data displays formats. Select one or a combination of parameters to enable the Run Report button. The Resources Report selection provides the ability to select one or more level options (student, resource, course, and/or sub-orgs) and start and end dates to narrow the report down to your specific needs. Select whether or not you want to see the Sub-Orgs and/or the Personal Info columns on the report. |
Resources Report Example (Run in summary mode)
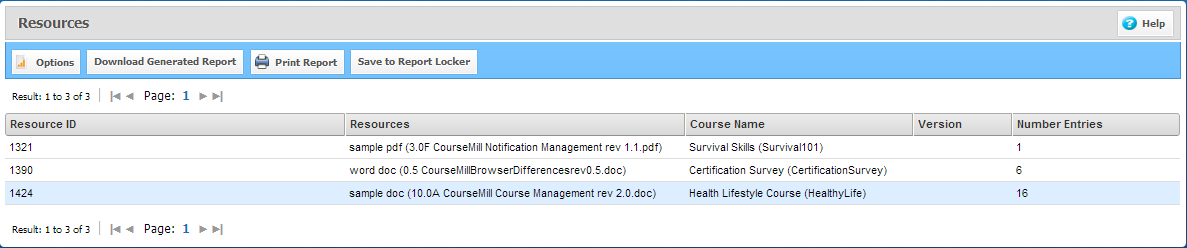
Run in detail mode

Due Dates
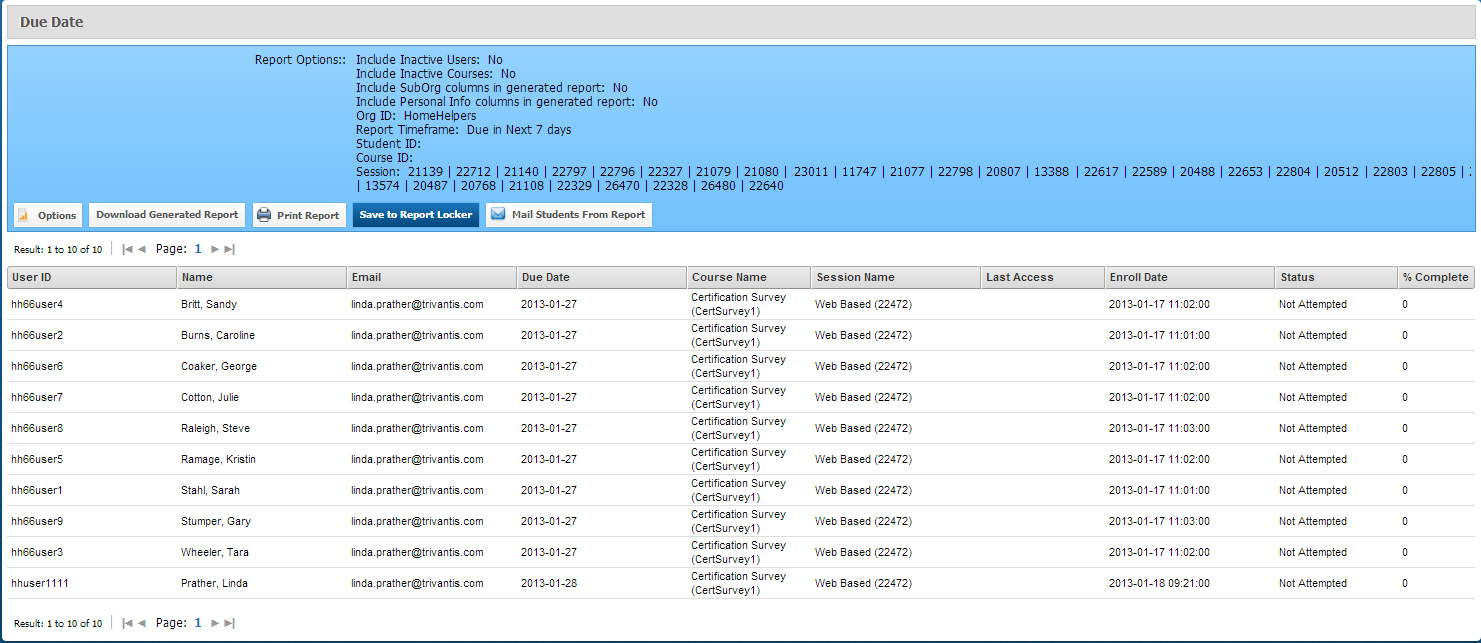
The Due Dates report provides information on students who are enrolled in courses that have due dates and what their status is on meeting that due date. Easily complete compliance reporting by instantly running reports on the completion status of courses and see the status for specific names and last access dates. Easily filter out all information by your desired subject and export the reports directly into an Excel spreadsheet.
|
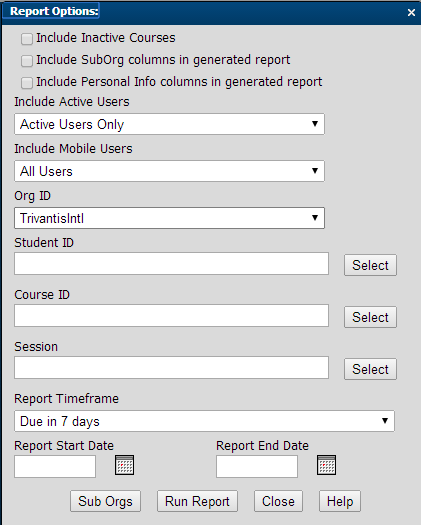
Due Date Report Parameters Check or uncheck the Inactive Users/Courses boxes to switch between the different data displays formats. Select one, or a combination of parameters, to enable the Run Report button. The Due Date report selection provides the ability to select one or more level options (student, course, session, and/or report timeframe) and start and end dates to narrow the report down to your specific needs. Select whether or not you wish to see the Sub-Orgs and/or the Personal Info columns on the report. |
Due Date Report Example
Interactions
The Interactions report provides information on Summary interaction or detailed statistics by student. View detailed information on certain questions and have the ability to view the specific student’s answers to desired questions. This enables you to see how difficult specific questions are for students. Interaction reports also show counts of answers to each question.
|
|
Requires that test-question interactions are included (SCORM or AICC) when courses are published. Lectora will provide these using the Publish to CourseMill option. |

|
Interactions Report Parameters Check or uncheck the Summary Statistics box to switch between the two different data displays formats. Select one, or a combination of parameters, to enable the Run Report button. The Interactions selection provides the ability to select one or more level options (student, course, session, question information, and content item) to narrow the report down to your specific needs. You can also select start and end dates to narrow your selection. Select whether or not you wish to see the Sub-Orgs and/or the Personal Info columns on the report. Requires that test-question interactions are included (SCORM or AICC) when courses are published. Lectora will provide these using the Publish to CourseMill option. |
Interactions Report Sample

Scores
The Scores report provides information such as scores that were recorded for each course. Using this report, you can quickly view each student’s individual scores on specific courses.
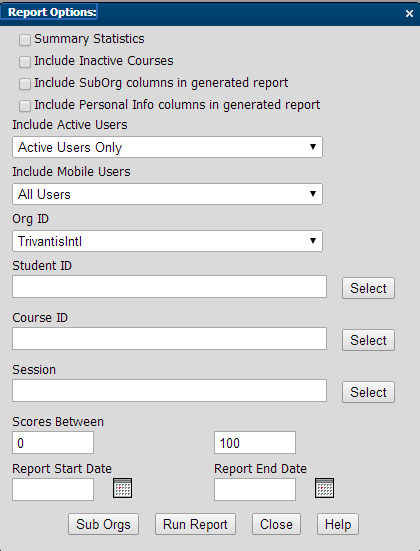
Scores Report Parameters
Check or uncheck the Summary Statistics box to switch between the two different data displays formats.
Select the inclusion of inactive users or courses, if desired.
Select whether or not you wish to see the SubOrgs and/or the Personal Info columns on the report
The Scores selection provides the ability to select one, or more level options (student, course, and/or session) to narrow the report down to your specific needs.
Select the range of scores for which you are looking.
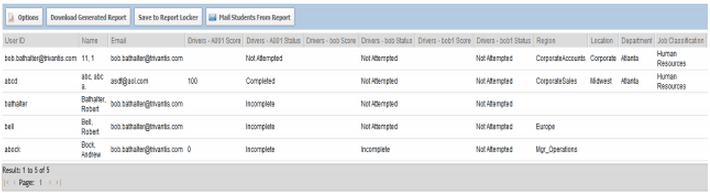
Score Report Example

Gradebook
The Gradebook report provides information on grades across students and courses, helping in staying organized. It also provides students with an easy-to-read scoring system by utilizing a traditional gradebook style of reporting to display instructor-led training test scores and status.
Gradebook Report Parameters
Select the inclusion of inactive users or courses, if desired.
Select whether or not you wish to see the Sub-Orgs and/or the Personal Info columns on the report
The Gradebook selection provides the ability to select one, or more level options (student, course, and/or session) to narrow the report down to your specific needs.
Select entire sub-orgs on which to report.
Select the start and end dates to report on specific time frames.
Gradebook Report Example
Transcript
The Transcripts report provides a number of summary transcripts all in one report. It can provide a view of the history of all students to see what courses were taken, what scores they received, how long it took them to complete each course, and more.
|
Transcript Report Parameters
|
Transcript Report Example
![]()
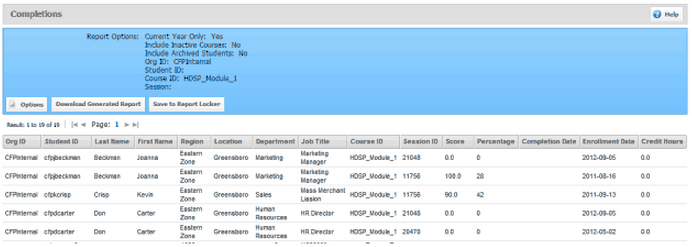
Completions
The Completions report provides a list of all those students who completed a course/session.
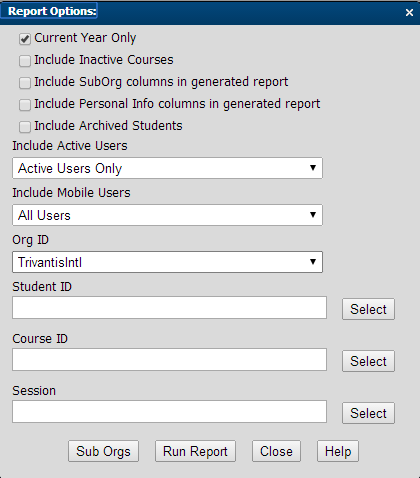
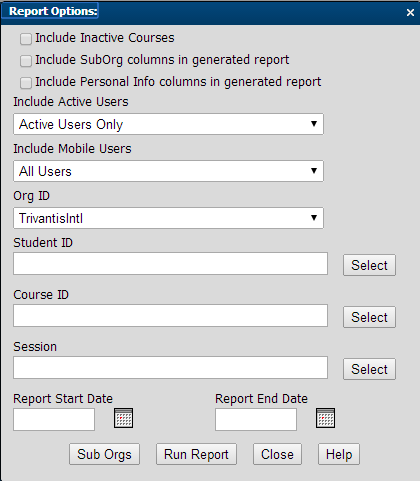
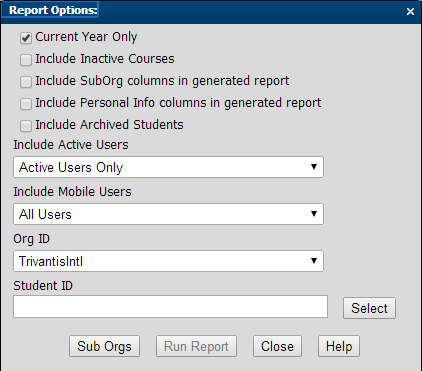
Completions Report Parameters
Select whether to report on the current year only.
Select whether or not you want to include inactive courses or archived students
Select whether or not you wish to see the Sub-Orgs and/or the Personal Info columns on the report
Select your organization, and if you want to narrow your search by Student ID, Course ID, or Session, and/or
Select by entire Sub-orgs.
Completions Report Example
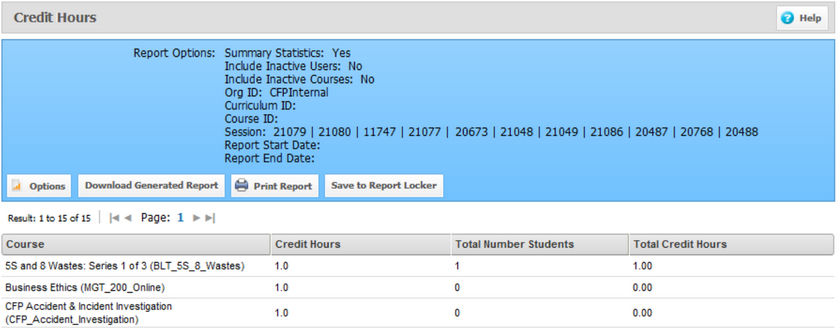
Credit Hours
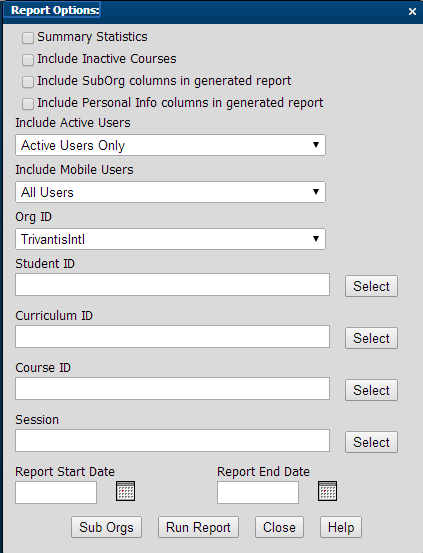
Credit Hours Report Parameters
Check or uncheck the Summary Statistics box to switch between the two different data displays formats.
Select the inclusion of inactive users or courses, if desired.
Select whether or not you wish to see the Sub-Orgs and/or the Personal Info columns on the report
The Credit Hours selection provides the ability to select one, or more level options (student, curriculum, course, and/or sessions) to narrow the report down to your specific needs.
Select start and end dates to narrow your selection and
You can also select specific sub-orgs as well.
Credit Hours Report Example
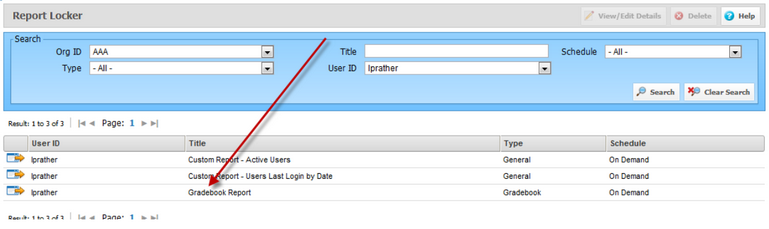
The Report Locker is a storage area where you can save reports that are customized to your needs. You can run any report by selecting Save To Report Locker in the top navigation.

When you select Save to Report Locker, it will bring up your current report locker and add your selected report to the bottom of the list and will label it the same name as the report you ran. In this example above, we selected Save to Report Locker when we were running the Gradebook Report. Thus when it was saved to the report locker area, it was initially saved to the same name.
From here you can change several items by clicking the View/Edit Details, which will bring up the following screen. You can change the title to a more meaningful name.
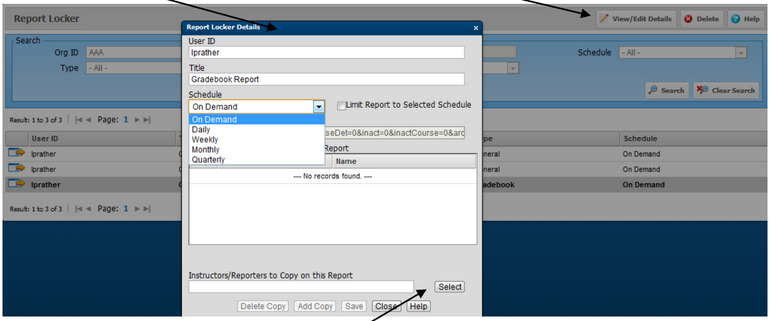
Select a schedule for when the report is to automatically run:

If the report is to be limited to the selected schedule, then be sure to select the check box to the right.

If a report runs weekly, it only provides data activity for that particular week. You can also provide a copy of this report to any instructors or reporters.
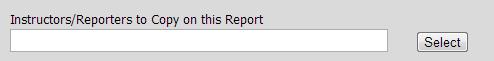
Click Select to view what Instructors/Reporters are available to choose from and the following screen will allow you to choose and return selected items to then save:

This will ensure that reports will be automatically scheduled and delivered to your email inbox (and those that you copied) on a consistent basis.
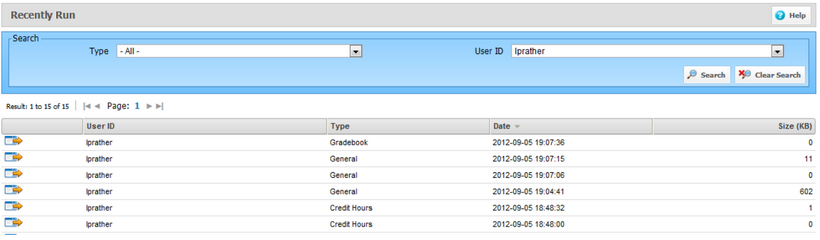
This selection is simply a list of recently run reports that were processed by an organization or a particular user. This feature is only available to administrators to audit the reporting performance of the system. For example, if a large report is running every day that is affecting performance, you might want to schedule it to run at night.
If you have the Advanced Reporting module, disregard this section and create your reports using that tool. Otherwise, custom reporting can be done this way using the following instructions..
You can create just the report you want with CourseMill's custom reports. Generate reports based on predefined database views, custom database queries, or external scripts. This section will most likely require the expertise of your IT department.
Custom reports can be downloaded or saved for quick retrieval or for automatic scheduling in the Report Locker. Many times you can copy and paste the SQL statements from one report and use that code in your newly created custom report. To see the code in any General report:
Click View/Edit Details of any General Report to see the code used to create that report.

Copy the SQL code and use it to paste into a new Custom Report you are creating.
To generate a custom report based on a predefined database view:
Expand Reports from the left-side navigation menu and select General.

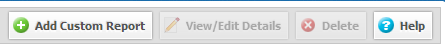
Then select the Add Custom Report button from the top navigation menu.
The Custom Report window opens.

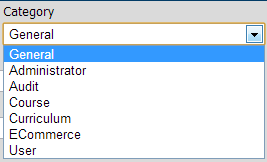
Select the category in which this report will be classified.
Select the type of report:
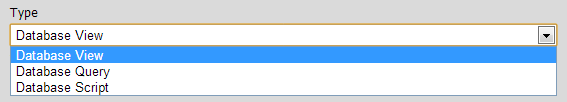
If you select Database View:

Select the pre-defined database view from the View Name list
Specify a description of the report in the Description field.
If necessary, select on or more to the Report Available To check boxes.
Click Save.
The results are displayed in the window. Click a column heading to re-sort the table.
If you select Database Query:
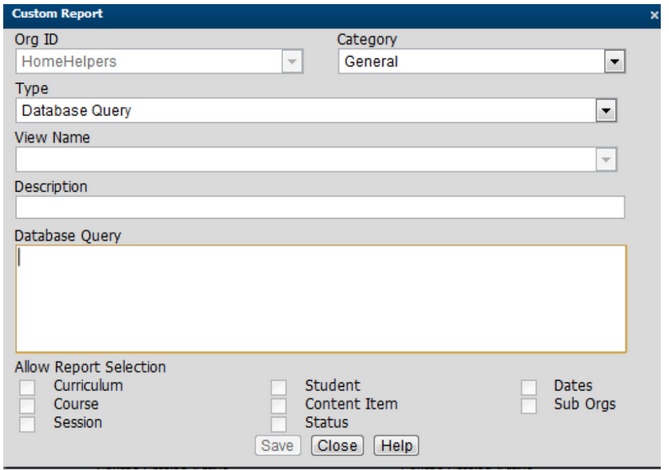
Select the pre-defined database view from the View Name list.
Specify a description of the report in the Description field.
Database Query (enter your SQL code)
Enable the appropriate report selection options in the Allow Report Selection list.
|
|
The report selection fields are enabled if you include in the select fields the corresponding column keys or they are enabled as part of the conditional where clause of the query. The Status option is enabled if you include either StudentCourse.Status or Sco.Lession_Status. The Dates option is enabled if you include any of the following: Student.LastLogin, StudentCourse.LastAccess, StudentCourse.CompletionDate, CourseSession.StartDate, or CourseSession.EndDate. |
Click Save.
The results are displayed in the window. Click a column heading to re-sort the table.
If you select Database Script:
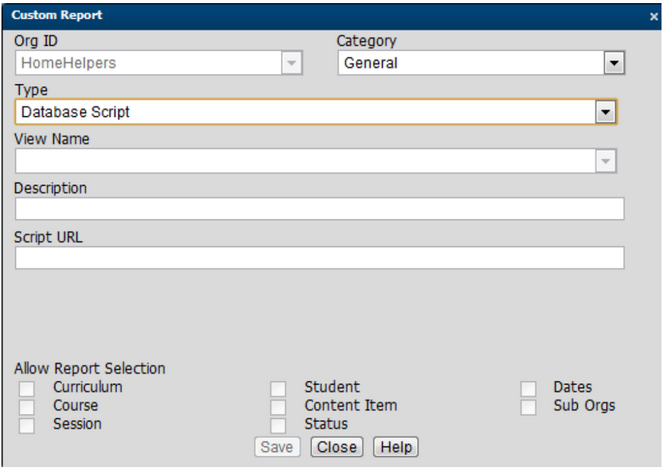
Select the pre-defined database view from the View Name list.
Specify a description of the report in the Description field.
Specify the address to the script in the Script URL field
Enable the appropriate report selection options in the Allow Report Selection list.
|
|
The report selection fields are enabled if you include in the select fields the corresponding column keys or they are enabled as part of the conditional where clause of the query. The Status option is enabled if you include either StudentCourse.Status or Sco.Lession_Status. The Dates option is enabled if you include any of the following: Student.LastLogin, StudentCourse.LastAccess, StudentCourse.CompletionDate, CourseSession.StartDate, or CourseSession.EndDate. |
Click Save.
The results are displayed in the window. Click a column heading to re-sort the table.
To generate a report based on an external database script, the script must return XML records based on the following passed parameters and in the following XML format:
|
Parameters |
Description |
|---|---|
|
orgID |
Organization ID |
| currID |
ID of the curriculum (configured in CourseMill) |
| courseID |
ID of the course (configured in CourseMill) |
|
sessionID |
ID of the session (configured in CourseMill) |
|
scoID |
ID of the SCO (configured in CourseMill) |
| status |
lesson_status or status (configured in CourseMill) |
| startDate |
Beginning day of the report |
| endDate |
Ending day of the report |
|
suborg0-n |
Suborgs |
| start |
Starting record if pagination is available |
Response in XML format:
<reportlist>
 <totalRecs>1</totalRecs>
 <numRecs>1</numRecs>
 <hdr0>StudentID<hdr0/>
 <hdr1>StudentName<hdr1/>
 <hdr2>LastLogin<hdr2/>
 <report>
  <col0>TestStudent</col0>
  <col1>Lastname, FirstName</col1>
  <col2></col2>
 <report>
</reportlist>
|
|
CourseMill provides a sample callable script SampleCustomReport.jsp located in the root in your CourseMill.jsp installation. See the contents of this file for details. |
© Copyright Trivantis Corporation 2015